Research · Halloween 2026
CandyBench.
CandyBench evaluates the frontier capabilities in candy distribution.
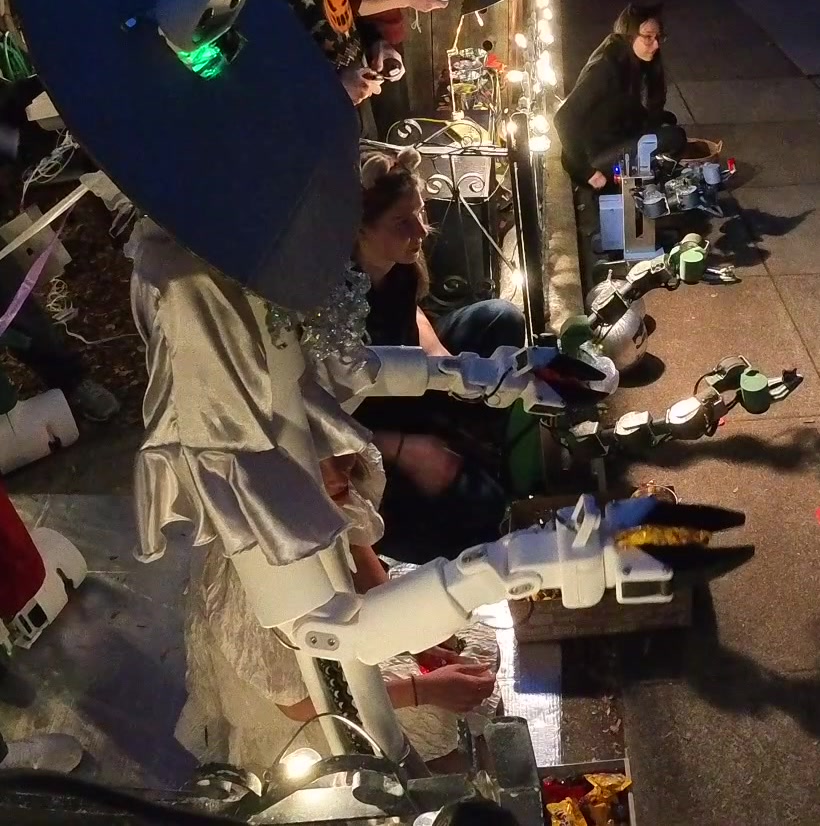
The 2026 edition covers three robots at one candy station on Halloween night, with two baselines: people handing candy over, and an unattended bowl.
We estimate 580 completed robot handoffs over a 95-minute eval window (95% CI 422–738), from 41 of 380 clips sampled at random and annotated by hand. Short Green has the highest point estimate; the three robots’ intervals overlap.
Research by OROHalloween 2026, 6:20 PM to 8:00 PMPublished November 2, 2026
- Robot handoffs, 95% CI 422–738
- ≈580
- All handoffs including baselines, 95% CI 496–797
- ≈647
- Clips annotated (11%)
- 41 / 380
- CI half-width on the robot total
- ±27%
01 · Results
Short Green ranks first on point estimate. The robots are not separable.
Each estimate is the number of completed handoffs in the 95-minute eval window, extrapolated from the annotated sample with a stratified estimator. Intervals are approximate 95% confidence intervals for sampling error only. They do not include annotation error or handoffs the camera could not see.
Point estimates order the robots Short Green, Tall and Short Blue. Their intervals overlap substantially, so we do not claim a ranking. The baselines come from the same station on the same night and are reference rates, not a matched comparison. The bowl was not optimizing for throughput.
Figure 1Completed handoffs in the eval window, with 95% CIs
Estimated handoffs (occluded time = 0), 95% CI · higher is better →
02 · Uncertainty
Sample size is the bottleneck.
- Clips annotated
- 41 / 380
- Median annotation time per ~15 s clip
- 37 s
- Annotated time Short Blue was occluded
- 31%
- Annotator (no agreement estimate yet)
- 1
Handoffs are bursty. Most clips contain no handoff from any given robot, and a few contain four or five in fifteen seconds. With 41 clips, that variance dominates the interval width. Figure 2 shows every annotated clip.
Figure 2Robot handoffs per annotated clip, by time of night
Figure 3 projects the CI half-width as the sample grows, assuming new clips resemble the current sample. The finite-population correction takes sampling error to zero at a full census of 380 clips. Occlusion and annotation error would remain.
Figure 3Projected CI half-width vs. clips annotated
Clips annotated
03 · Automatic grading
Automatic graders do not beat predicting zero.
Hand annotation costs about 37 s per clip, so we tested two automatic graders against the human labels. Neither can replace them yet.
- Human-annotated handoffs the VLM grader matched (20 clips)
- 10 / 35
- VLM candidates with no matching annotation
- 15 / 25
- Robots where the video model beats predicting zero (primary metric)
- 0 / 3
- Robots where it beats both baselines on squared error
- 1 / 3
VLM grader. A vision-language model read sampled frames from 20 clips and marked handoffs. Counting even the candidates it flagged as uncertain, it matched 10 of 35 human-annotated handoffs (same source, within 1.5 s), and 15 of its 25 candidates matched nothing.
Video model. A classifier over frozen video features predicts each clip's handoff count. We pre-registered absolute error per clip as the primary metric, against two baselines: predict zero, and predict the training mean. On the primary metric it does not beat predict-zero for any robot. Predict-zero is strong here because most clips contain no handoff from a given robot. On squared error (secondary), Tall is the only robot where the model beats both baselines.
Table 1Primary metric: absolute error per clip
| Robot | Model | Predict zero (Δ) | Predict mean (Δ) | Result |
|---|---|---|---|---|
| Tall | 0.44 | 0.49-0.28 to +0.17 | 0.60-0.27 to -0.07 | Does not beat predict-zero |
| Short Green | 0.55 | 0.51-0.08 to +0.19 | 0.66-0.27 to +0.03 | Does not beat predict-zero |
| Short Blue | 0.54 | 0.43-0.08 to +0.29 | 0.61-0.15 to +0.02 | Does not beat predict-zero |
Table 2Secondary metric: squared error per clip
| Robot | Model | Predict zero (Δ) | Predict mean (Δ) | Result |
|---|---|---|---|---|
| Tall | 0.32 | 0.71-0.77 to -0.08 | 0.51-0.38 to -0.03 | Beats both baselines |
| Short Green | 0.72 | 0.86-0.33 to +0.06 | 0.63-0.09 to +0.29 | No clear difference |
| Short Blue | 0.50 | 0.71-0.48 to +0.02 | 0.57-0.14 to +0.02 | No clear difference |
The model is still useful as a control variate. Prediction-powered inference (stratified difference estimator, pre-registered) narrows Tall's interval by 12% relative to human annotation alone; Short Green and Short Blue are unchanged. The leaderboard uses human annotation only, and the held-out split has not been used.
Figure 4Tall: human annotation only vs. prediction-powered inference
Estimated handoffs, 95% CI →
04 · Method
Method
- Task
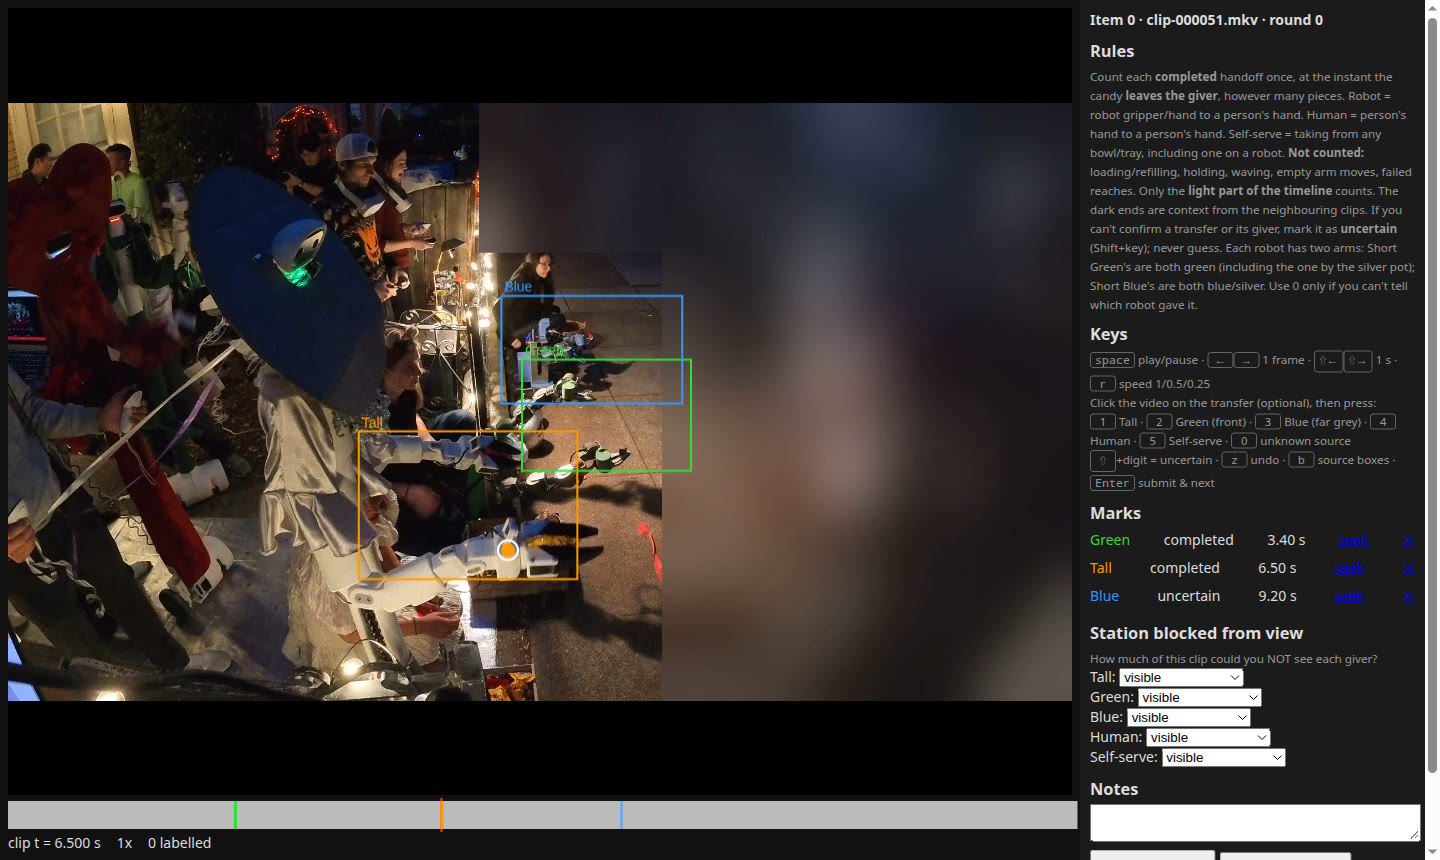
- A completed handoff is one transfer of candy from a giver to a recipient, counted once regardless of pieces and timestamped when the candy leaves the giver. Taking candy from any open bowl or tray is self-serve, including when the bowl is sitting on a robot. Refills, waving, holding candy and failed reaches are not handoffs. Events the annotator could not confirm are marked uncertain and excluded from the main estimates.
- Eval set
- One fixed camera recorded the station from 6:20 PM to 8:00 PM. We hold out 7:20–7:25 PM as a test split for automatic graders and have not opened it. The remaining 95 minutes form 380 clips of about 15 s.
- Sampling
- Stratified random sample: 19 strata of 5 minutes, 20 clips each. The annotation queue was randomized before annotation began and draws one clip per stratum per round. We report the first 41 clips, with none skipped. Totals use the stratified estimator with a finite-population correction and a t multiplier (22 degrees of freedom).
- Annotation
- One annotator labelled every clip in a purpose-built tool (Figure 5), seeing the clip plus 2 s of context on each side; only the clip itself counts. The annotator never saw model predictions, earlier labels or AI output. Inter-annotator agreement has not been measured.
Figure 5Annotation tool
- Occlusion
- The crowd often blocked the camera. Occluded time counts as zero handoffs. Short Blue was occluded for an estimated 31% of annotated time.
- Distribution shift
- Robots were repositioned during the evening; Short Green spent part of it on a chair. Robot positions were re-marked by hand every 2.5 minutes for the video model.
- Compute
- Feature extraction used $17.33 of GPU time on Modal.
- Privacy
- No video is published. The two stills on this page are cropped or blurred so that no children appear.
05 · Limitations
Limitations
- Single annotator. No inter-annotator agreement estimate yet.
- Sampling error only. The intervals exclude annotation error and occluded handoffs.
- Wide intervals. ±27% on the robot total; the per-robot intervals overlap.
- One station, one night. Robots moved, crowd density varied, and the baselines are not matched to the robots.
- Automatic grading is exploratory. No model beats predict-zero on the primary metric.
- Held-out split unopened. 7:20–7:25 PM has not been used.
Cite CandyBench
@misc{oro2026candybench,
  author = {{ORO}},
  title = {{CandyBench}},
  year = {2026},
  url = {https://oroagents.com/benchmarks/candybench},
  note = {Frozen snapshot: 2026-11-02}
}
Happy Halloween.